The post Melanoma incidence rose 120 percent since 1982, new Cancer Australia data shows appeared first on Manta Ray Of Hope.
]]>The long-term trend in the data
Age-standardised melanoma incidence rose from 29.6 to 65 cases per 100,000 people between 1982 and 2019, a 120 percent increase. In raw numbers, 2019 alone recorded 15,628 new melanoma diagnoses nationally, split between 9,134 men and 6,494 women.
Part of that rise reflects genuinely improved detection rather than a proportional increase in actual disease occurrence, since dermoscopy and structured screening programs have become far more widespread since the 1980s. Separating true incidence growth from detection-driven growth remains an ongoing challenge for epidemiologists working with this kind of long-run data.
Lifetime risk figures reflect that gender gap clearly: men face a 1 in 14 chance of a melanoma diagnosis compared with 1 in 21 for women, while mortality risk by age 85 sits at 1 in 164 for men versus 1 in 340 for women.
Researchers attribute part of the gender gap to differences in sun protection behaviour and healthcare-seeking patterns, with men historically less likely to apply sunscreen consistently or present early when a suspicious spot appears, a pattern that shows up across multiple national datasets, not just Cancer Australia’s figures.
The survival numbers tell a more encouraging story

Despite rising incidence, five-year melanoma survival improved from 90 percent in the 1990 to 1994 period to 93.6 percent for people diagnosed between 2015 and 2019. That gain reflects earlier detection and improved treatment options rather than any drop in underlying risk.
Cancer Australia’s data also shows a notable decline in age-specific melanoma rates among people under 40 since the late 1990s, a trend widely attributed to sustained SunSmart-style prevention programs reaching younger Australians earlier in life.
That generational divide is a useful case study in what effective, sustained public health messaging can achieve. Australians who grew up with sun safety education from childhood are now showing measurably lower age-specific melanoma rates than earlier generations did at the same age, even as overall population incidence keeps climbing.
Why early detection still carries the most weight
The gap between rising incidence and improving survival is explained almost entirely by detection timing. Melanomas caught early are overwhelmingly more treatable than those found after they’ve progressed, which is why survival curves have moved even as diagnosis numbers haven’t slowed.
That gap is the practical argument for regular, structured monitoring rather than waiting for a visibly changing mole to prompt action. Comprehensive Dermatology Clinics Australia checks using dermoscopy and photographic mole mapping are designed specifically to catch the kind of early-stage changes that raw incidence statistics can’t show on their own.
The survival gain from 90 to 93.6 percent over roughly 25 years might look incremental on paper, but applied across tens of thousands of annual diagnoses, it represents a meaningful number of lives where earlier detection was almost certainly the deciding factor between a straightforward excision and a far more serious course of treatment.
With skin cancer treatment now costing the health system more than $1.72 billion annually, the economic argument for early detection lines up with the clinical one. Whatever incidence does over the next decade, the survival data makes clear that timing of diagnosis, not the disease itself, remains the biggest variable within a patient’s control. The 120 percent rise since 1982 is unlikely to reverse quickly, but the survival curve shows what happens when detection keeps pace with it.
The post Melanoma incidence rose 120 percent since 1982, new Cancer Australia data shows appeared first on Manta Ray Of Hope.
]]>The post How a Below-Normal Hurricane Forecast Could Ease Pressure on Central Texas Roofers appeared first on Manta Ray Of Hope.
]]>A quieter Gulf and Atlantic season could reduce the chance of statewide labor, material, and claims resources being redirected to a major coastal hurricane, but that remains a conditional effect rather than an observed easing of Austin roofing pressure.
Seasonal hurricane outlooks are produced twice a year by NOAA’s Climate Prediction Center, once in late May before the season officially opens and again in early August once more of the season’s atmospheric setup has come into focus. The August update is generally treated as the more reliable of the two, since it incorporates real observed ocean temperatures rather than the longer-range projections the May outlook has to rely on. That timing matters for anyone in the roofing trade trying to plan crew and material commitments for the back half of the year.
A Strengthening El Niño Is Doing Most of the Work
The driver behind the calmer outlook is an unusually strong El Niño pattern building in the eastern Pacific. NOAA’s data show water temperatures in the El Niño monitoring zone running 2.07 degrees Celsius above average, a reading that exceeds prior “Super El Niño” events recorded in 2015, 1997, 1991, and 1982, the four benchmark years meteorologists still compare every strong El Niño against.
Some forecast models suggest this could turn out to be the strongest El Niño since consistent records began in 1950. El Niño years tend to increase upper-level wind shear across the tropical Atlantic, which makes it harder for hurricanes to organize and strengthen even when storm seeds do form.
Austin rarely takes a direct Atlantic hurricane strike, so the connection is mainly through regional supply chains, traveling crews, and insurance resources.
El Niño winters also tend to bring a wetter, more active subtropical jet stream across the southern United States once the calendar turns toward late fall and winter. That pattern can increase the odds of heavier rain events over Texas even as it suppresses tropical storm formation, a distinction that matters for roofers because heavy rain exposes existing roof damage that hail and wind left behind earlier in the year.
What Fewer Coastal Disasters Could Mean for Regional Capacity

A major Gulf Coast landfall can pull materials, equipment, crews, and adjusters toward the disaster zone. Fewer such events would reduce the probability of that particular disruption. For companies handling roofing in Austin, a quieter hurricane forecast would only reduce one potential source of regional disruption; it would not change Central Texas hail risk.
That does not guarantee better Central Texas material availability. Supplier capacity is affected by many other variables, including local storms and normal construction demand.
Traveling labor can move between storm markets, but the direction and size of those movements vary by event.
Claims resources can also be reassigned after large catastrophes, though the effect on an individual Austin claim depends on the insurer and event.
Why “Below-Normal” Is Not the Same as “No Risk”
NOAA’s own release included a pointed caveat alongside the encouraging numbers. The agency warned that a record-breaking El Niño event could produce atmospheric impacts never before seen, an acknowledgment that unusually strong climate patterns do not always behave predictably.
A single hurricane can still create major regional disruption even in a below-normal season, and an unrelated Central Texas hailstorm can create its own local backlog.
Central Texas homeowners and property managers are better served treating the forecast as a modest tailwind rather than a guarantee. September remains climatologically active for the Atlantic basin, and Central Texas’s own severe weather season, driven separately by spring and early-fall hail and wind events, does not fully track hurricane statistics anyway.
The best way to read the forecast is as a modest reduction in one source of regional disruption—not as evidence that Central Texas roofers or homeowners have a quiet storm season ahead.
The post How a Below-Normal Hurricane Forecast Could Ease Pressure on Central Texas Roofers appeared first on Manta Ray Of Hope.
]]>The post Central Texas Is Aging Along the I-35 Corridor, and Tooth Replacement Is Following appeared first on Manta Ray Of Hope.
]]>In May 2026, the policy group Texas 2036 worked through the Census Bureau’s newest population estimates and laid the shift out plainly. Texas hit 31.7 million residents by mid-2025, but its growth is slowing and its median age is climbing toward the mid-forties over the coming decades.
The corridor effect
Where that aging population lives matters as much as how big it gets. The same analysis found that 87% of Texans live east of the I-35 corridor, packed into the metro triangle anchored by Dallas, Houston, San Antonio, and Austin.
That corridor isn’t an abstraction to the towns sitting on it. Kyle, Buda, San Marcos, and New Braunfels ride Interstate 35 between Austin and San Antonio, absorbing both the metros’ growth and the aging that comes with a maturing suburban ring. Texas 2036 notes that the growth increasingly happens at the suburban and exurban edges rather than in the dense cores. Those edge communities skew toward families and retirees who bought in for space and affordability, and who plan to stay. Texas 2036 projects the state drifting toward what demographers call “ultra-aged” territory in the decades ahead, with the 65-and-older share climbing steadily instead of leveling off. A slice of that older population is landing in exactly these corridor suburbs.
Why aging in place changes dental demand
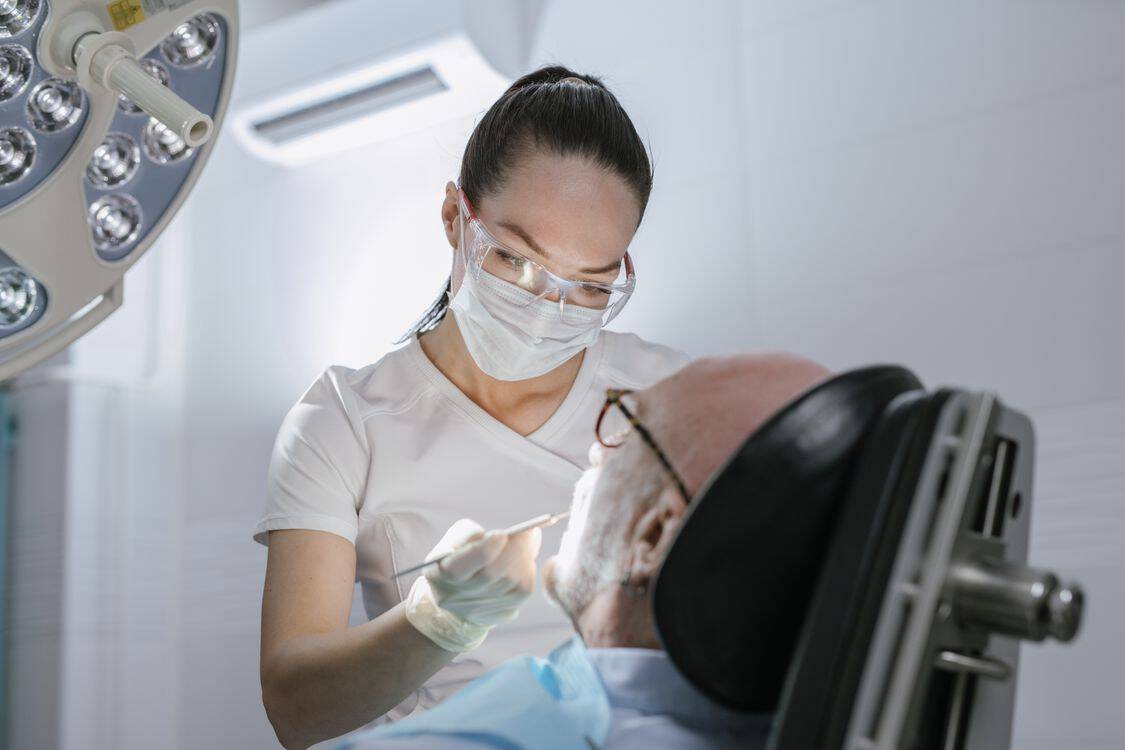
An older population that stays put generates steady, local demand for services that used to cluster in big-city specialty centers. Tooth loss is one of the clearest cases.
The link is simple. Rates of partial and complete tooth loss climb with age, and the generation now moving through its sixties and seventies is far less willing to settle for removable dentures than its parents were. Many watched a relative fight a slipping plate at the dinner table and decided they wanted something that stays put.
That expectation runs straight into geography. A retiree in a town south of Austin doesn’t want to drive into the city for a year of appointments. Demand pools locally, and the providers who can handle complex restorative work close to home are the ones who catch it. Texas 2036 frames the broader pattern as a workforce and services problem stretching across health care, and dental care is a quiet piece of it. As the share of residents over 65 rises, the volume of restorative dentistry rises with it.
A slower-growing, older market
Here’s the counterintuitive part. Slower overall population growth doesn’t mean slower demand for age-related services. Often it means the reverse, because the makeup of the population keeps tilting older even as the headcount climbs more gently.
For the corridor towns, that reads as a durable, structural rise in the need for tooth replacement, bone-preservation work, and the upkeep that fixed restorations ask for. It isn’t a trend that flips with the next economic cycle. The math also explains why implant-focused practices have been opening in mid-sized Texas communities instead of clustering only inside Austin or San Antonio. The patients are where the corridor put them, and increasingly they expect to find care without leaving it.
None of this settles what any one person should choose. Candidacy still comes down to bone, health, and circumstance. But the wide-angle picture is fixed: an aging corridor produces rising, localized demand for permanent tooth replacement, and Central Texas is one of the clearest examples in the country.
The post Central Texas Is Aging Along the I-35 Corridor, and Tooth Replacement Is Following appeared first on Manta Ray Of Hope.
]]>The post What the Updated Shortage Occupation List Means for a Work Visa in Singapore appeared first on Manta Ray Of Hope.
]]>The Shortage Occupation List identifies roles MOM considers in high demand but short on qualified local professionals. Landing on the list is worth up to 20 bonus points under COMPASS, on top of the four foundational criteria that determine the baseline 40-point threshold. For select technology roles specifically, SOL eligibility can also extend an Employment Pass’s validity to five years, well beyond the standard two or three.
Who Fell Off the List, and Who Was Added
Several technology-related roles were removed in the 2026 revision, including Cyber Risk Specialist, Cybersecurity Operations Specialist, and Product Manager (Digital). Healthcare roles were added in their place. For companies that had built hiring plans around the bonus points and extended validity those tech roles used to unlock, the removal is a real, not cosmetic, change to how competitive a given application now looks.
The guide is direct about the consequence: candidates whose applications previously cleared COMPASS comfortably by leaning on SOL bonus points may now sit closer to the 40-point threshold, since foundational criteria alone have to carry more of the weight the SOL bonus used to provide.
Why Renewals Deserve Earlier Attention Than New Hires

The updated criteria apply to new applications from 1 January 2026 and, separately, to renewals from 1 July 2026. That second date is where the guide’s advice gets most specific: employers should not wait until a renewal deadline to assess whether an existing EP holder’s role still qualifies under the revised SOL, because a role that cleared easily under the old list may need to lean on other criteria entirely under the new one.
Companies with hiring pipelines built around technology roles that lost SOL eligibility face a particular version of this problem. In some cases, SOL eligibility may now play a reduced role in offsetting weaker scores elsewhere, particularly for the specific technology functions where roles were removed, which means candidates in those functions may need stronger salary or qualification scores to compensate.
What Employers Should Actually Do With This
The practical guidance is to reassess current EP candidates and existing pass holders against both the updated salary benchmarks and the revised SOL before, not during, the application or renewal window. since the removed occupations may require restructuring the application around salary or qualification criteria that weren’t previously load-bearing.
The broader pattern in the 2026 SOL revision, healthcare additions paired with select technology removals, also signals where MOM currently sees the sharpest gap between local supply and demand. That’s a useful signal beyond just the immediate compliance question, for any company weighing where in Singapore’s labour market a foreign hire is likely to clear scrutiny most easily going forward.
The post What the Updated Shortage Occupation List Means for a Work Visa in Singapore appeared first on Manta Ray Of Hope.
]]>The post What a Bite-Force Study Reveals About Eating Steak and Chicken With Dentures appeared first on Manta Ray Of Hope.
]]>That limitation is not a matter of willpower or getting used to the appliance. It is mechanical, and the research measuring it is unusually clear.
Understanding why traditional dentures struggle with tough foods explains a lot about why so many wearers end up eating around their own teeth.
The Force Gap Nobody Mentions at Fitting
Chewing is a contest of force, and dentures lose it. Natural teeth generate substantial bite pressure. A conventional complete denture delivers a small fraction of that, and the gap is wide enough to change what a person can realistically eat.
A clinical study comparing conventional dentures with implant-supported overdentures quantified the difference in a memorable way. It reported that denture wearers need roughly seven times more chewing cycles to break food down to the same degree as people with natural teeth.
Seven times the effort to achieve the same result. That is the lived reality behind the polite phrase difficulty with certain foods.
Tough, fibrous items are where it shows most. Steak and other dense meats, raw vegetables, crusty bread, and anything that requires sustained shearing force are precisely the foods a low-force appliance handles worst.
The underlying numbers are stark. Where natural teeth bring a chewing load in the range of 200 newtons to the task, the forces a complete-denture wearer can muster often fall to somewhere between 60 and 80. That is not a small shortfall. It is a different category of capability.
Many wearers reach for adhesives to close the gap, but that is a workaround with its own costs. The pastes can alter how food tastes, need constant reapplication, and still do not restore the force that the missing bone foundation used to provide.
There is a digestive angle that often goes unmentioned. Chewing is the first stage of digestion, and food that arrives in the stomach poorly broken down asks more of everything downstream. The consequences of a weak bite do not stop at the plate.
Why the Problem Compounds Over Time

The force gap is not static. It widens, because the bone under a traditional denture keeps resorbing after the teeth are gone, and less bone means less support and less chewing pressure.
That is why dentures loosen with age and why a plate that managed a chicken breast a few years ago may struggle with it later. The foundation is eroding underneath.
A loose denture also brings movement into the equation. Dentures shift during chewing because the surrounding muscles dislodge them, so wearers brace, slow down, and avoid the foods most likely to break the seal.
The predictable response is a retreat to soft, easy foods. That keeps mealtimes manageable but narrows nutrition, often toward more processed options that ask less of the bite.
That retreat carries health costs that compound quietly. A diet skewed toward soft, processed foods tends to be denser in refined carbohydrates and lighter in the fiber, lean protein, and fresh produce that require real chewing. Over years, eating around your own teeth can nudge weight and nutrition in the wrong direction without any single dramatic moment to mark it.
How Implant Anchoring Changes the Menu
The reason implant-supported solutions come up in this conversation is that they attack the force problem at its source. Anchoring the restoration to posts in the bone restores stability the gums alone cannot provide.
That stability translates into dramatically more chewing force. Implant-supported options recover a large share of natural bite strength, enough that hard and fibrous foods move back onto the plate.
The same clinical comparisons that exposed the force gap also showed implant-retained overdentures closing much of it, with chewing efficiency and bite force landing far closer to natural dentition than conventional plates manage.
The contrast is measurable rather than impressionistic. In studies putting the same person through both kinds of appliance, conventional dentures required substantially more chewing strokes than implant-retained overdentures to reduce food to the same particle size. The implant anchoring did not just feel better. It changed the mechanics in a way you could count.
For the person whose real question is whether they will ever bite into a steak comfortably again, that is the meaningful distinction. It is not denture versus no denture. It is whether the restoration is anchored to bone or resting on a shrinking ridge.
It helps to picture what anchoring actually does. A conventional plate floats on the gums and is held only by suction and the surrounding muscles, which is why it shifts the moment real force is applied. Posts fixed into the jaw give the restoration something solid to push against, so the force a person generates goes into the food instead of into dislodging the appliance.
So the steak question has a real answer. With a conventional denture, tough foods will likely stay difficult and may get harder over time. With a stable, implant-anchored solution, the menu opens back up, because the force that was missing is largely restored.
Eating well is not a small thing in later life. It shapes nutrition, social life, and plain daily pleasure, and the difference between bracing through every meal and simply eating is worth understanding before settling for the appliance that asks seven times the effort.
The post What a Bite-Force Study Reveals About Eating Steak and Chicken With Dentures appeared first on Manta Ray Of Hope.
]]>The post Why Anyone Can Call Themselves a Roofer in Texas, and What That Costs Austin Homeowners appeared first on Manta Ray Of Hope.
]]>That gap is not an oversight anyone is rushing to close, and it shapes the entire experience of hiring a roofer in this state, especially in the frantic weeks after a storm.
A Trade With No Gatekeeper
The Roofing Contractors Association of Texas does not soften the point. By its own account, the state imposes no licensing, registration, or insurance requirements on roofing contractors austin whatsoever, and the Texas Department of Licensing and Regulation does not administer any roofing license at all.
There is a voluntary credential. The association runs its own licensing program, which requires experience, insurance, and passing exams, and a contractor who holds it has chosen to clear a bar the state never set. But it is opt-in, and plenty of working roofers never bother.
The consequence is blunt. Anyone with a truck, a ladder, and a magnetic sign can call themselves a roofing company in Texas tomorrow morning, with no test, no bond, and no registry a homeowner can check.
The Deductible Pitch That Crosses Into Fraud
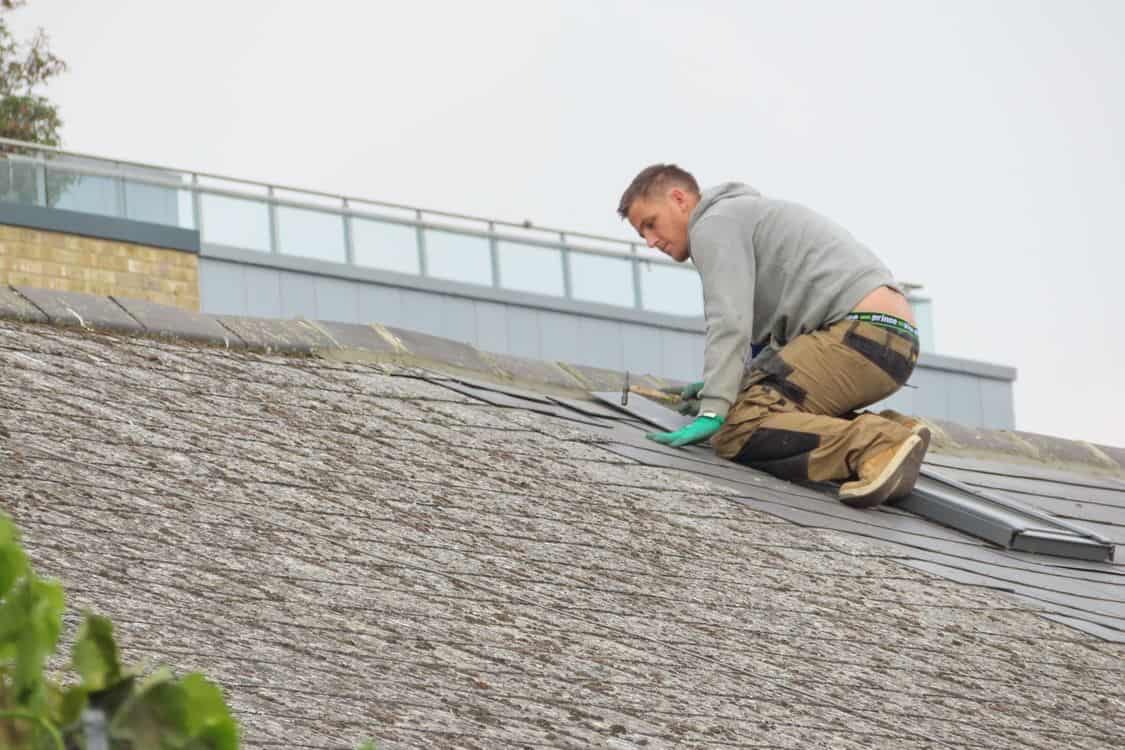
Into that vacuum walks the storm chaser. After every major hail event, out-of-state crews flood the affected neighborhoods, knock on doors before homeowners have even called their insurer, and lean on urgency as their main sales tool.
The single most reliable red flag is the deductible offer. When a contractor promises to waive, absorb, or work around your insurance deductible, they are not handing you a discount. Under Texas law that has been a criminal act since 2019, and it exposes the homeowner as well as the contractor.
The logic is worth sitting with. A company that cannot survive without your deductible has to recover that money somewhere, which usually means cheaper materials, cut corners on installation, or an inflated claim invoice. If a contractor is willing to break one law to win the job, the question of what else they will cut answers itself.
What Actually Protects an Austin Homeowner
Because there is no state registry to lean on, the burden of vetting falls entirely on the property owner, and the checks that matter are not complicated. Confirm a physical local address, not a P.O. box. Ask for current general liability and workers’ compensation certificates before any work starts.
Look hard at the company’s track record in the actual community. A business with real roots has a visible presence, trucks people recognize, and a review history tied to a name that will still exist next spring. A profile created six months ago with a sudden burst of five-star reviews is a warning, not a recommendation.
The absence of a license in Texas is not going to change before the next hail season. What can change is how a homeowner responds to it, by treating the state’s hands-off approach as a reason to do more homework rather than less. In an unregulated market, the diligence a buyer brings is the only real license that matters.
The post Why Anyone Can Call Themselves a Roofer in Texas, and What That Costs Austin Homeowners appeared first on Manta Ray Of Hope.
]]>The post Why a Toronto Roof Replacement Now Books Weeks Out, According to Builders appeared first on Manta Ray Of Hope.
]]>The constraint is no longer money or materials in most cases. It is people, specifically the shortage of skilled hands to do the work, and that shortage has reordered how a homeowner has to plan.
The constraint builders keep naming
Industry leaders have pointed to the skilled-trades shortage as the binding constraint on construction in the Greater Toronto Area. The workforce is aging structurally, with more than one in five construction workers now over the age of 55 and heading toward retirement.
You can secure the financing, pull the permits, and order the material, the argument goes, but if there is no qualified crew to do the work, the timeline simply stalls. Roofing feels this acutely because it cannot be automated or rushed. It is skilled labour on a ladder, and there is no shortcut around having enough of it.
What it changes for the homeowner

The practical effect is a longer lead time between signing a contract and seeing a crew on the roof. The strong companies carry a backlog precisely because they are in demand, so a quality roofer with an immediate opening in peak season is increasingly the exception, and sometimes a small warning sign.
This reframes how a homeowner should shop. The question is no longer just “what is the price” but “when can a reputable crew actually do this job, and will they show up when they said they would.” Availability and reliability have become part of the value, not afterthoughts.
How to work with the new reality
Planning ahead is the entire game. Booking an inspection and quote before the busy season, rather than after a leak has already started, is what gets a homeowner onto a good crew’s calendar at a reasonable price and a reasonable date.
It also rewards a bit of homework on the front end. Identifying the credible firms early and reaching out before the spring rush means you are choosing from the best options rather than from whoever happens to be free during an emergency, which is rarely the same group.
Reliability is now a premium feature
In a labour-constrained market, the qualities that used to be assumed, showing up on the agreed day, communicating about delays, finishing the job before moving to the next, have become genuinely scarce and genuinely valuable.
A roofer who keeps a schedule and tells you the truth about timing is worth more than one who is simply cheap and available, because cheap-and-available in peak season often means a crew with nothing else booked, for reasons that become clear once the work begins. In this market, a dependable timeline is part of what you are paying for.
The post Why a Toronto Roof Replacement Now Books Weeks Out, According to Builders appeared first on Manta Ray Of Hope.
]]>The post How the Bridge Replacement Wave Is Driving Demand for Structural Bridge Steel appeared first on Manta Ray Of Hope.
]]>The grade that fills most of those orders is the family of structural steel written specifically for bridges, and the scale of the need is enormous.
The backlog is the story
The condition of the national bridge network is sobering. By the latest count, 1 out of 3 U.S. bridges still needs to be repaired or replaced, even as the share rated in poor condition slowly improves.
That works out to hundreds of thousands of structures, with tens of thousands sitting in poor condition and carrying traffic every day. The repair bill runs into the hundreds of billions of dollars.
The 2021 federal infrastructure law created a dedicated bridge formula program to attack that backlog, and states have been steadily committing those funds to projects. As of mid-2025, a little over half of the available formula money had been committed.
That leaves a long runway of work still to be funded and built. For the construction sector, and for the steel supply chain behind it, that backlog reads as years of demand.
Why bridges get their own steel specification

Bridge steel is not just structural steel that happens to end up on a bridge. It is held to a higher standard, because the consequences of a bridge failing are categorically different from those of a beam in a warehouse.
That is why bridges are built to a dedicated specification. A grade like ASTM A709 covers structural steel made specifically for bridges, with mandatory toughness requirements that ordinary structural grades do not have to meet.
The toughness requirement is the key difference. Bridges carry cyclic loads, sit outdoors through temperature extremes, and have to resist brittle fracture, so the steel must demonstrate impact resistance at low temperatures.
The specification is also a family rather than a single grade. It spans standard structural strength levels, weathering versions that resist corrosion without paint, and high-performance grades engineered for the most demanding spans.
That range lets a bridge designer pick the right balance of strength, toughness, and corrosion resistance for a given structure, all under one umbrella specification written for the job.
What the wave means for steel suppliers
For anyone supplying plate into bridge work, this is one of the more dependable demand stories in the market.
Public infrastructure spending is planned years in advance and insulated from the swings that buffet private construction. A funded bridge program is a demand signal a supplier can actually plan around.
It is also demanding work. Bridge steel comes with strict certification, toughness testing, and traceability requirements, and the fabricators who win this work need suppliers who can deliver fully documented, specification-compliant plate without drama.
That favors suppliers who understand the bridge specification family and can support the right grade selection, whether a project calls for a standard strength level, a weathering grade, or a high-performance steel.
The bridge backlog did not appear overnight, and it will not clear overnight either. For the better part of a decade, replacing and rehabilitating America’s bridges will keep calling for the structural steel written specifically to hold them up.
The post How the Bridge Replacement Wave Is Driving Demand for Structural Bridge Steel appeared first on Manta Ray Of Hope.
]]>The post A Brutal Flu Season Is a Good Reason to Look at the Mat Your Hands Touch All Day appeared first on Manta Ray Of Hope.
]]>The instinct to power through illness is deeply ingrained in work culture, and it is expensive. Showing up sick does not keep productivity intact; it spreads the illness while delivering a fraction of the usual output.
The numbers are larger than most people imagine. Presenteeism, the practice of working while sick or impaired, costs U.S. businesses up to $150 billion annually, which is roughly ten times the cost of employees staying home. The person toughing it out is not saving anyone anything.
The Hidden Cost of Showing Up Sick
Absenteeism is visible and easy to measure. Someone is missing, the gap is obvious, and the cost is the work that did not get done. Presenteeism hides because the person is right there at their desk, logged in and apparently working.
But an impaired worker produces well below their normal level while still drawing a full salary, and the gap between what is paid and what is delivered accumulates invisibly across every department. The math is brutal precisely because it is hard to see.
The worse part is the contagion. A sick employee at a shared workspace becomes a distribution node, seeding the next round of illness through every surface they touch and every colleague they pass.
This is why illness clusters rather than spreading evenly. One person’s decision to come in sick can take down a whole team, turning a single case into a staffing crisis during the weeks an organization can least afford it.
Surfaces Are How the Spread Happens

Respiratory illnesses move through the air, but a large share of transmission happens through surfaces. Someone coughs into a hand, touches a keyboard, a desk, a shared mouse, and the next person picks up what they left behind.
The surfaces that matter most are the high-touch ones, the objects that hands contact constantly throughout the day. At a desk, that means the keyboard, the mouse, and the surface they sit on, all of which see near-continuous skin contact.
A fabric desk mat is a particularly easy thing to overlook in all this. People will wipe a keyboard or a phone during cold season but rarely think to clean the pad their hands rest on for eight hours straight.
That blind spot matters more during a severe respiratory season, when the volume of pathogens circulating through a workspace is higher and the consequences of an unaddressed reservoir of germs are steeper.
Cleaning the Desk as Basic Illness Hygiene
The standard advice during flu season focuses on hands and shared equipment, and rightly so. But the personal workspace deserves a place on that list, because it is where a person spends the most concentrated contact time of the entire day.
Wiping down the high-touch surfaces of a desk regularly during a bad season is a small habit with an outsized return. It costs a minute and reduces the chance that a desk becomes a reservoir that re-infects its owner or their household.
For the soft surfaces that resist a quick wipe, a washable one makes the difference between a cleanable workspace and a permanent germ trap. Being able to actually launder the surface the hands live on turns it from a blind spot into a manageable part of the routine.
The behavioral problem underneath all of this is that workplace culture often rewards showing up sick. Employees who drag themselves in are seen as dedicated, and the ones who stay home worry about appearing replaceable. That incentive structure all but guarantees that sick people keep contaminating shared spaces.
Individuals cannot fix that culture on their own, but they can control their own corner of it. Keeping a personal workspace clean during a bad season is one of the few germ-related variables fully within a single person’s power, regardless of what colleagues choose to do.
That is part of why the desk surface is worth singling out. Hand-washing depends on discipline repeated dozens of times a day, and shared-surface cleaning depends on everyone cooperating. Cleaning the surface your own hands rest on all day is entirely up to you, and it covers the spot you contact more than almost any other.
The home setup deserves the same scrutiny as the office one, especially for anyone splitting their week between the two. A household where one person gets sick tends to pass it around precisely because the shared and personal surfaces never get reset between rounds, and the desk is one of the easiest of those surfaces to overlook.
The deeper shift worth making is to treat the personal desk as part of illness hygiene rather than as someone else’s job or a once-a-year deep clean. A rough respiratory season is the natural prompt. The hands spend more time on the desk surface than on almost anything else in the day, and during the weeks when illness is tearing through workplaces, that is exactly the surface worth keeping clean.
The post A Brutal Flu Season Is a Good Reason to Look at the Mat Your Hands Touch All Day appeared first on Manta Ray Of Hope.
]]>The post As Weather Claims Triple Across Canada, Mississauga Roofs Face Tougher Standards appeared first on Manta Ray Of Hope.
]]>It is easy to tune out climate-and-insurance headlines as background noise. But the shift they describe is showing up in real terms, in deductibles, coverage conditions, and the standard a roof has to meet, which makes it worth a homeowner’s attention.
The decade-long climb
Insured losses from catastrophic weather and wildfires in Canada have nearly tripled over the past decade, climbing to $37 billion annually, with the number of claims almost doubling over the same period.
That is not a single bad year distorting the picture. It is a sustained, decade-long shift in how often and how hard severe weather strikes, and roofs are on the front line of nearly every weather claim. When the industry’s losses triple, the industry responds, and homeowners feel that response at renewal.
What it changes for homeowners

As losses mount, insurers tighten terms, and the standard a roof must meet to stay protected and insurable rises with them. A roof that was perfectly adequate a decade ago may not clear today’s bar, either in how it performs or in how an insurer views it.
The forces driving those claims, freeze-thaw cycles, wind, ice, and intense rain, are precisely the ones that expose a roof’s weak detailing. As they grow more frequent, the margin a marginal roof used to enjoy keeps shrinking, and the cost of a roof that fails under stress keeps rising.
The case for building to the harder standard
The sensible response is to build for the climate that is arriving, not the one that has passed. Proper attic ventilation, generous ice-and-water protection, robust flashing, and well-designed drainage are what let a roof meet tougher conditions without failing, and they are decisions made at installation.
Because those decisions are invisible once the roof is finished, the choice of installer effectively is the choice of resilience. In a tripling-loss climate the cheap roof is usually the expensive one, so hiring a firm with a real track record for the harder standard, rather than the lowest bidder, is the more rational long-term bet.
Resilience is the new baseline
The broader point is that what counted as a good roof is being redefined upward by the weather itself. Features that once seemed like optional upgrades, full ice-and-water coverage, careful ventilation, oversized drainage, are becoming the baseline for a roof that survives current conditions and satisfies a cautious insurer.
For a Mississauga homeowner, that argues for hiring on demonstrated quality and building a bit beyond the minimum. A roof built to last through the climate that is coming is also the roof most likely to stay affordably insured through it, which makes resilience not just a safety decision but a financial one.
The post As Weather Claims Triple Across Canada, Mississauga Roofs Face Tougher Standards appeared first on Manta Ray Of Hope.
]]>